Handwriting Biometrics: From Pen Strokes to a Behavioral Fingerprint
Can the way someone writes become a behavioral fingerprint? Sometimes, with caveats, and the caveats are where the engineering lives.
By Mouad Krikbou19 September 2026 · 16 min read
Every signature is a record of a hand moving through space and time. That sounds like a platitude until you record one properly. Then it becomes the whole argument.
A pen on paper leaves ink. A stylus on a tablet leaves something else: where the tip was, when it was there, how hard it pressed, how it was tilted, how long it hovered before the first stroke and how long it paused between the second and the third. Two people can produce signatures that look nearly identical and move in completely different ways. The ink is the least interesting part.
That raises the question this article follows: can the way someone writes become a kind of behavioral fingerprint?
My answer is "sometimes, with caveats," and I want to spend most of the article on the caveats, because that is where the engineering lives. But I want to displace a myth first. The interesting thing about handwriting biometrics is not whether a single signature identifies a single person. It is that a signature carries a distribution of habits, and a distribution is what you can actually build on. The single sample is a myth, and it is a myth that sells demos.
Handwriting is motion
A parametric curve is the natural description of handwriting, and it is the only simple one that survives loops and pen reversals.
The smallest unit is a point on the page, P = (x, y). A stylus samples the pen tip many times a second, so one stroke becomes a sequence P₀, P₁, …, Pₙ. Each sample can carry more than position:
- x, y: where the tip is
- t: when it was there, to the millisecond
- p: pressure on the surface
- tilt: the angle of the pen
The first instinct is to describe a stroke as a function y = f(x), like a graph in school. That breaks the moment the pen moves straight down, doubles back, or draws a loop. One x then has several y values, and a function cannot express several values for the same input.
The fix is to describe both coordinates as functions of a third variable, t, the progress along the stroke:
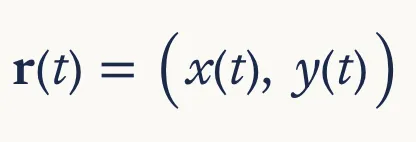
As t increases, the curve may cross itself, reverse and loop, and it stays a valid description. A richer version keeps the dynamics as well, turning handwriting from a static image into a record of human movement:

Here p is pressure, v is speed, and θ is pen direction or tilt.
This is the point where the field splits in two, and it is the split that matters most. Online handwriting is captured live by a device: timing, pressure and stroke order are recorded. Offline handwriting is scanned from paper, and a scan holds only pixels. Stroke order, timing and pressure are already gone.
My position is simple. Online is where the signal lives. Offline still has a role, in document examination, in stylistic comparison, in historical analysis, but it is a different discipline and it should be labeled as one. The two are routinely conflated in marketing material, and the conflation is not harmless. It lets a product claim the rigor of online biometrics while delivering an image classifier.
Fitting a curve to the points
Curve fitting finds a smooth curve close to the recorded points without copying their noise. One parameter decides how much wobble to keep.
Sensors are noisy and hands tremble. The basic goal is a curve C(t) whose distance to the recorded points is as small as possible. Adding a penalty on bending keeps it from chasing every jitter:
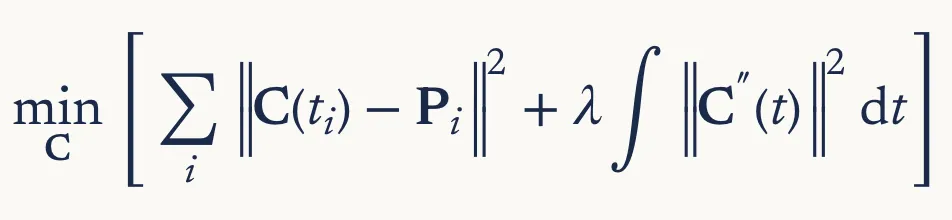
The first term rewards staying close to the writing. The second term penalizes unnecessary bending. A small λ follows the trace closely; a large λ gives a smoother, simpler curve.
Two families of curves do this job well, and they describe the same signature in very different ways. I am deliberately not going to pick a winner, because the honest answer is that they are two views of the same object, and the right thing to do is let people see both.
Piecewise cubic Bézier curves
The stroke is split into short pieces, and each piece is one cubic curve set by four control points:
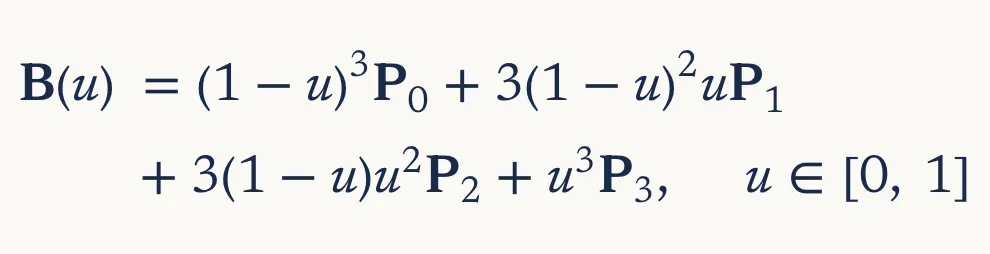
Philip Schneider's curve-fitting algorithm, published in Graphics Gems in 1990 (Schneider, 1990), works in four moves:
- Find sharp corners and split the stroke there.
- Fit one cubic to each run by least squares.
- Nudge the curve's parameters closer with Newton's method.
- If any point is still further than a tolerance ε, split at the worst point and fit both halves again.
The result follows loops, sharp turns and cursive joins without one enormous, unstable equation. It is also how fonts and vector graphics are stored, which means there is a mature body of tooling around it and a generation of engineers who already know how to read it.
Fourier series
A Fourier series describes a whole stroke as one sum of waves. Treat the pen position as a complex number z = x + iy. Trace the stroke forward and then back, so the path returns to its start. That symmetric path needs only cosine terms:
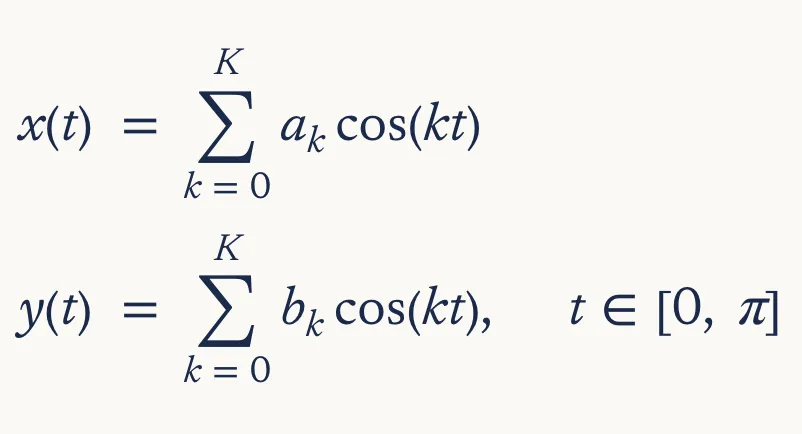
Few harmonics K give a rough outline; more give every detail. Each term is also a pair of circles rotating in opposite directions. Chained tip to tail, those circles trace the signature, which is the "epicycle" animation that circulates online every few years.
The two models trade off differently. Bézier pieces are local and exact to a stated tolerance. A Fourier series is global and compact, but it rounds sharp corners unless it keeps many terms.
For a production system, Bézier usually wins on inspection, because you can point at the control points and defend the fit to a stakeholder who has never heard of a basis function. But the Fourier view tells you something Bézier does not: how much of the signature is rhythm rather than shape. A stroke with strong low harmonics has a smooth, flowing cadence. A stroke that needs many high harmonics is full of sharp turns. That is a biometric property, and it is worth seeing.
If you build something like this, my recommendation is to render both and let the user switch. The switching is not a gimmick. It is the fastest way to make someone understand that a signature is not an image.
What a curve lets us measure
Once writing is a curve, its habits become numbers: how sharply it bends, how fast it moves, how hard it presses. These describe tendencies, not fixed shapes.
The central geometric measure is curvature, how strongly the path bends at each moment:
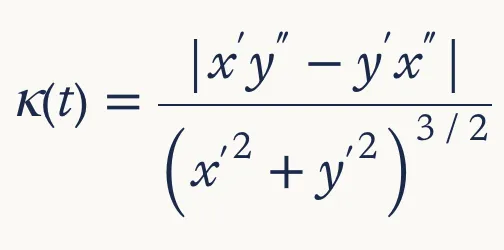
High curvature marks a tight loop or a sharp turn; low curvature marks a straight run. A circle of radius r has curvature 1/r everywhere. Because the formula does not depend on how t is scaled, it measures the shape itself, not the speed at which it was drawn.
From the same data a system can compute many other features. Some are visible in the ink, and any scan has them:
- Slant: the average lean of the down-strokes
- Proportions: letter height, width, loop size, upper against lower zone
- Spacing and baseline: gaps between letters and words, the drift of the line
- Curvature distribution: how often the writer loops or turns sharply
Others exist only if a digital pen recorded the writing:
- Speed and acceleration: the rhythm, and where the pen slows down
- Pressure: the force, often higher on down-strokes
- Pen lifts and pauses: how many strokes, how long in the air
- Stroke order and direction: which way loops are drawn, where strokes start
I want to say three things about these lists, in the order I would say them to a colleague.
First, the dynamic features, the second list, are the ones that matter for biometrics. Anyone can trace a shape. Almost nobody can reproduce rhythm, pressure and pen lifts at the same time. If your system cannot see the second list, you are doing graphology with better typography.
Second, and this is the point the lists hide, what identifies a person is not a feature value but a distribution of values across samples. A writer forms an "r" differently on different days. What tends to stay stable is the spread: similar motion, similar rhythm, similar spacing, similar proportions, sample after sample. Any system that compares a single number to a single threshold is comparing the wrong thing.
Third, the practical filter I would apply to all of this is survivability. Which features survive a change of pen, tablet, posture, mood and time of day? Some do. Many do not. That filter is the difference between a lab result and a deployable system.
Why a traced shape fails
Here is the worked example I use when someone asks why dynamic data matters.
A copyist traces a signature through paper, or overlays it on a tablet and follows the outline. Compare the geometric layer: slant matches, loop proportions match, spacing matches, curvature distribution is close. Every feature visible in the ink looks right, because it was copied from the right.
Now look at the dynamic layer. Pressure is uniform, because the copyist is drawing a line rather than writing a signature. Speed is constant, because the copyist is following an outline rather than accelerating through a downstroke. There are no pen lifts where the genuine signature has two, because the copyist drew one continuous line. Timing is wrong in a way that is hard to describe and very easy to detect: a genuine signature has a slow start, a fast middle and a deliberate finish, and the traced copy has the metronome rhythm of someone concentrating.
The traced shape passes the geometric check and fails the dynamic one. This is why the dynamic layer is the one I would build a system around, and why the geometric layer alone should never be enough to approve anything.
From one sample to a writer profile
Identification compares many curves, not one. A writer is described by a spread of measurements across samples, and a new sample earns a similarity score, not a verdict.
Suppose one person writes the same word ten times. The curves r₁(t), …, r₁₀(t) never overlap perfectly: speed, pressure and slant drift. Yet some relationships stay stable, such as where the pen slows down, whether a join is sharp or smooth, or the ratio of tall letters to short ones.
This is a correlation between functions, not a match of images. Two people can draw the same-looking letter "a" while one loops clockwise in a single stroke and the other lifts the pen halfway. The ink looks alike; the trajectories differ.
A system turns each sample W into a feature vector, and a set of samples into a model of the writer:
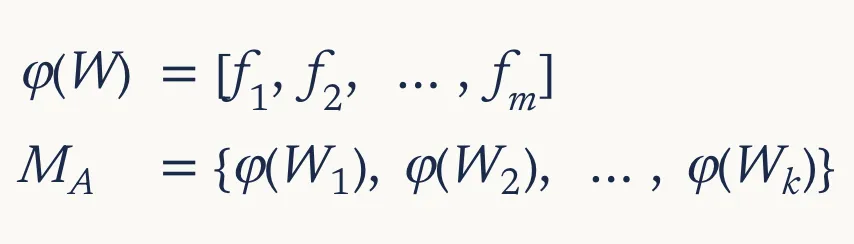
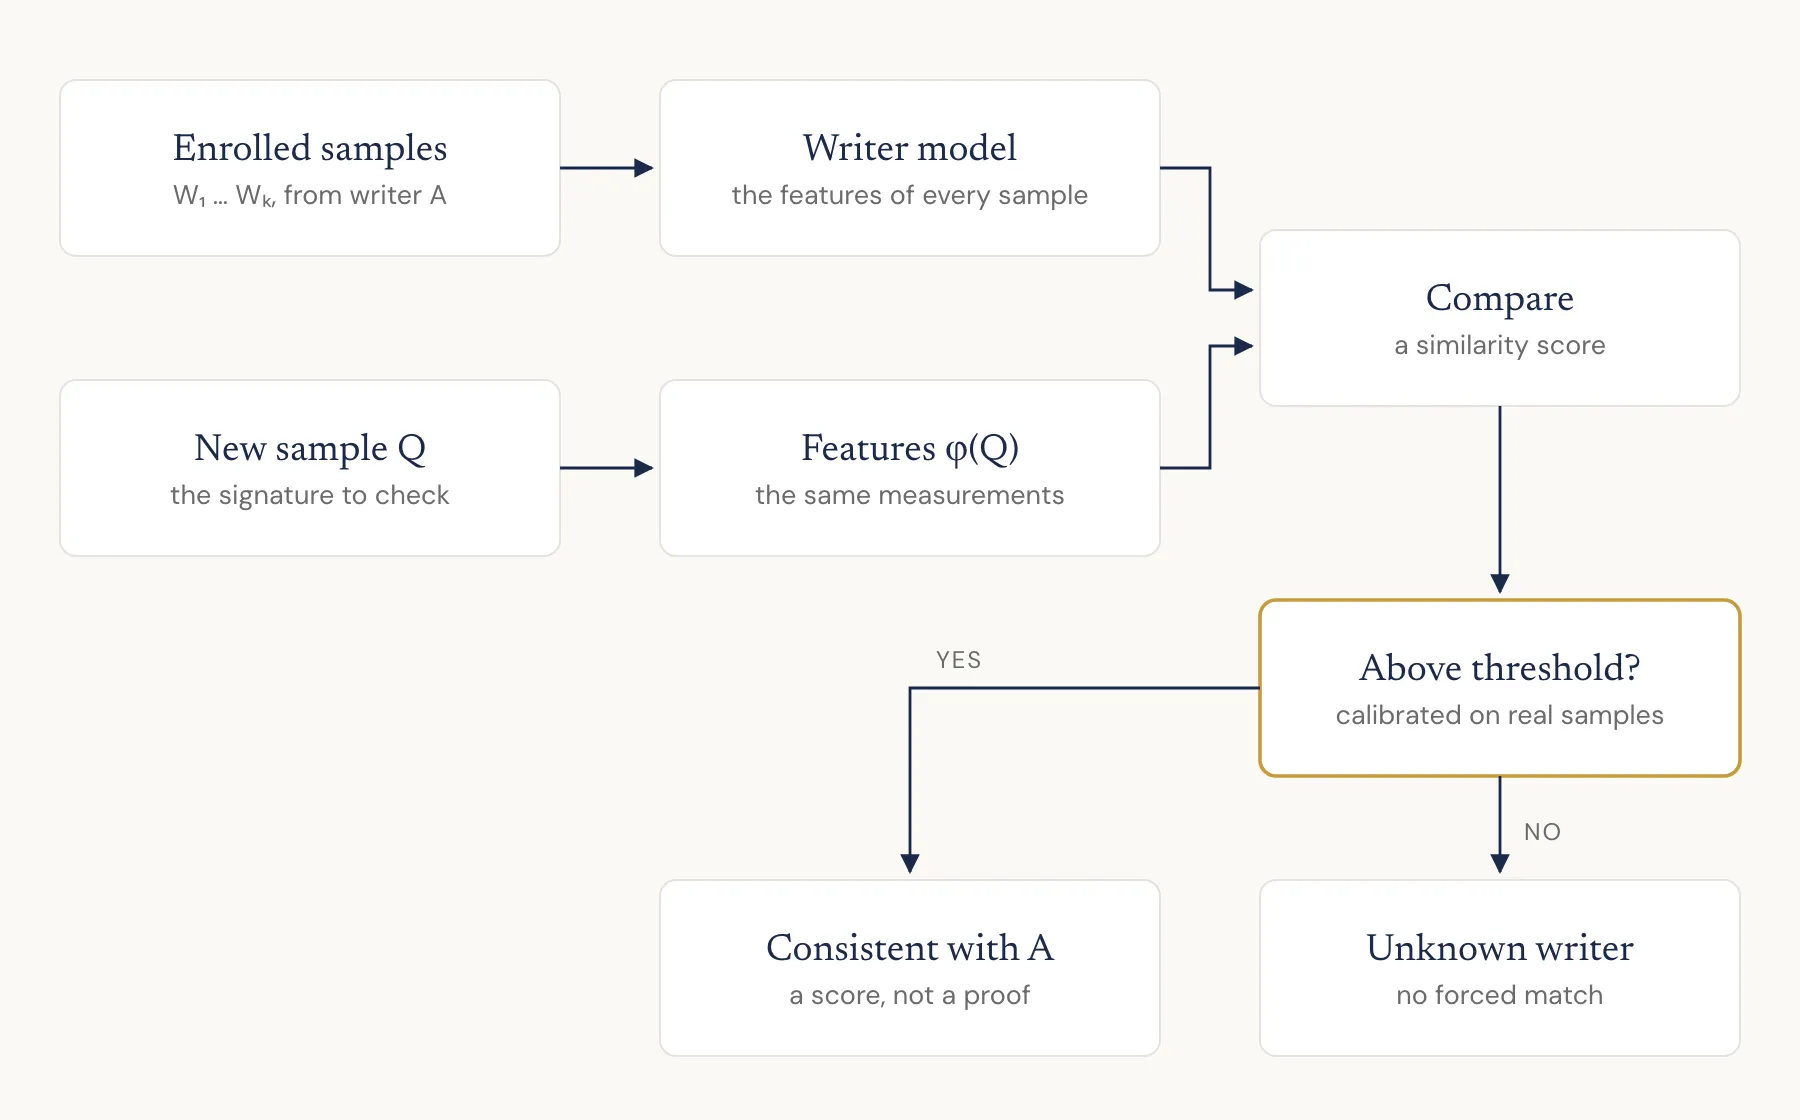
A new sample Q is measured the same way and compared with the model. The result is a number such as score(Q, M_A) = 0.82.
That 0.82 is not an 82% chance that A wrote the sample. It is a similarity that only means something once the threshold has been calibrated on real genuine and impostor samples.
This is the point where I would push hardest on any vendor, and it is the point most systems get wrong.
A score without a calibrated threshold is a number looking for a meaning. Calibrate it, or do not ship it. And a responsible system must be allowed to answer "unknown writer" instead of forcing every sample onto someone enrolled. A verifier that forces every sample onto a known identity is not identifying anyone. It is matching everyone.
But the deeper point, and the one I would put on the wall, is this: the model is not the asset. The calibration set is. Anyone can train a feature extractor. What separates a system that works from a system that produces confident nonsense is whether somebody collected a real set of genuine and impostor samples, under realistic conditions, and used it to set the threshold honestly. That dataset is expensive, it is unglamorous, and it is the only thing standing between you and a number that means nothing.
Three layers of evidence
A full writer profile can draw on three kinds of evidence. Only the first two are handwriting biometrics; the third is a separate field.
- Geometric, what the writing looks like: slant, loops, curvature, spacing, proportions.
- Dynamic, how it was physically written: pressure, speed, acceleration, pauses, stroke order.
- Linguistic, what the writer tends to say: vocabulary, spelling, punctuation, recurring phrases.
The linguistic layer is usually called authorship attribution or stylometry. Combining the layers can be powerful, but each can mislead on its own. A person may change their wording while their motor habits stay the same. Colleagues in one field may share vocabulary without being the same author.
Because each layer can mislead on its own, the responsible move is to keep them separated in the analysis and combine them only at the end, with the weighting stated. Not "we used everything and got 0.9." What did each layer contribute, and how much did you trust it? A combined score that hides the weighting is a score you cannot audit, and if you cannot audit it you cannot defend it when the decision is challenged.
The dynamic layer is the hardest to forge, and for that reason I would weight it most heavily in any high-consequence use. The geometric layer is the easiest to fake and the easiest to explain. The linguistic layer is the most context-dependent and the least stable across topic and register.
Limits, risks and privacy
Handwriting is far less stable than a fingerprint, so it works as a probabilistic signal, never as proof of identity on its own.
The same person writes differently depending on many things:
- The body: fatigue, stress, illness, medication, age
- The setting: posture, writing speed, surface, pen type, tablet model
- Intent: a writer can deliberately disguise their hand
A profile trained on slow, neat writing on one tablet may fail on quick writing on paper. Short samples make things worse, and models can confuse two people with similar styles. Forensic examiners put natural variation at the center of their work: they study its range within and between writers (NIST, 2020; Angel, 2024), and a fair comparison needs several known samples, of the same kind of writing and from about the same period (NIST, 2021).
Natural variation is not noise. It is the subject. Any system that treats it as noise will fail on the first bad day, and the first bad day is a Tuesday.
Privacy matters just as much. Timing, pressure and pen motion are behavioral biometric data. If stored, they deserve the same care as any authentication secret, and in my experience the right way to protect authentication material is to isolate it by design, not by policy. Not "we promise not to read it." It should not be in scope for anyone who does not need it, and it should not be in the same store as everything else.
The practical rules I would apply:
- Collect only what the purpose needs.
- Encrypt it and restrict who can access it.
- Keep it only as long as there is a justified reason.
- Make sure a named human owns the decision it feeds.
That last point matters more than it sounds. A handwriting score that feeds a decision about a person needs a person behind it: someone named in advance, who will answer for the decision if it turns out to be wrong. A score with no one accountable for its use has been computed, not governed.
And one more thing, because it is usually hidden by the marketing. "Not infallible" is not a weakness specific to handwriting biometrics. It is a property it shares with every biometric ever deployed. Fingerprints have false matches. Face recognition has demographic differences in its error rates (Grother, Ngan and Hanaoka, 2019). Iris scans can be spoofed. What distinguishes a responsible deployment is not whether the modality is perfect, because none of them are. It is whether the operator states the error rates, calibrates the threshold against them, and builds a process that can absorb the errors that inevitably occur. Products that present biometrics as certainty are not selling a stronger system. They are selling a system whose failures you will discover later.
Used well, handwriting evidence is one factor combined with others. It is never an infallible identity test.
See it for yourself: Signature Math
Signature Math is a browser app that walks through the first four steps of this article with your own signature. It stops before identification on purpose: one signature measures a moment, not an identity. It opens from the Handwriting Biometrics project.
- Sign on a pad with a mouse, finger or stylus. Each sample is recorded as position, time, pressure and tilt. Without a pressure-sensitive pen, pressure is simulated from speed, so fast strokes come out thinner.
- Read the equations. Switch between the Bézier view, with every segment's control points, and the Fourier view, with each stroke's cosine series. Sliders set the fit tolerance ε and the number of harmonics K, and the error shrinks as the equations grow.
- Measure curvature, speed and pressure over time, plus slant, pen lifts, pauses and proportions.
- Replay the signing. "Real rhythm" plays back your recorded timestamps, including every hesitation and pen lift, with a fountain pen moving across the page. The replay exports as a video or an animated GIF.
Everything runs in the browser; nothing drawn is uploaded or stored, in line with the privacy points above.
The replay is the feature I would point people to first, because it is the one that changes how they think about the problem. Watching your own signature drawn back at the speed you actually wrote it, hesitations included, does something that a list of features does not. It makes the movement visible.
Conclusion and open questions
Nobody has one secret handwriting equation. Each person has a distribution of recurring geometric and motor habits, and handwriting biometrics estimates how well a new sample fits it:
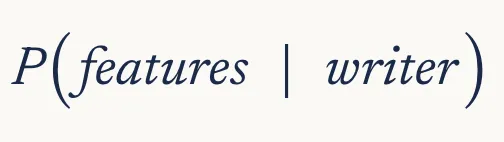
The path is short to state: point, curve, fit, features, model. The hard problems start at the end of it, which is why I want to end this article on questions rather than conclusions. The field is moving, and anyone claiming closure is selling something.
- How much handwriting is enough to identify a writer reliably?
- Which features stay stable across pens, devices, illness, stress and years?
- Can a model separate natural variation from deliberate imitation?
- How should scores be calibrated so no one mistakes them for certainty?
- Can one system work across languages, scripts and writing styles?
- Should dynamic writing data ever be stored long-term, and if so, how is it protected?
- Can interpretable features like curvature and slant stay competitive with deep learning while being easier to audit?
That is why handwriting biometrics is more than curve fitting. It sits where geometry, signal processing, machine learning, motor behavior, forensics and privacy meet. It is a good example of the general problem I keep coming back to in my own work: the model is the easy part, and the system around it decides whether anything useful comes out.
Which leaves a question I would genuinely like an answer to, and I do not have one. If a signature is a distribution of habits rather than a fixed shape, what does it mean to "verify" one at all? Every verification is a sample against a distribution, and every sample is a single point in a space that moves with fatigue, mood and the pen you happen to be holding. At what point does a useful probability become a false certainty? I suspect the honest answer is that the threshold matters more than the model, and that most deployments get this backwards. I would be interested to hear from anyone who has had to defend that threshold in front of someone it affected.
That is the part of handwriting biometrics I find genuinely interesting. Not the math, which is tractable. The governance, which is not.
References
Angel, M. (2024). Communicating Forensic Findings: Forensic Document Examination. Presentation slides, Los Angeles Police Department, June 2024. Published by NIST.
Faundez-Zanuy, M., Fierrez, J., Ferrer, M. A., Diaz, M., Tolosana, R. and Plamondon, R. (2020). Handwriting Biometrics: Applications and Future Trends in e-Security and e-Health. Cognitive Computation, pp. 940-953. A survey of the field.
Grother, P., Ngan, M. and Hanaoka, K. (2019). Face Recognition Vendor Test (FRVT) Part 3: Demographic Effects, NISTIR 8280. National Institute of Standards and Technology, December 2019.
NIST (2020). Forensic Handwriting Examination and Human Factors: Improving the Practice Through a Systems Approach, NISTIR 8282. The report of the Expert Working Group for Human Factors in Handwriting Examination, February 2020.
NIST (2021). Handwriting Examiners in the Digital Age. National Institute of Standards and Technology, 3 June 2021.
Plass, M. and Stone, M. (1983). Curve-fitting with piecewise parametric cubics. ACM SIGGRAPH Computer Graphics 17(3), pp. 229-239. An earlier least-squares approach to the same fit.
Schneider, P. J. (1990). An Algorithm for Automatically Fitting Digitized Curves. In A. S. Glassner (ed.), Graphics Gems, Academic Press, pp. 612-626.